
Introduction
When it comes to Big Data infrastructure on Google Cloud Platform, the most popular choices Data architects need to consider today are Google BigQuery – A serverless, highly scalable and cost-effective cloud data warehouse, Apache Beam based Cloud Dataflow and Dataproc – a fully managed cloud service for running [Apache Spark]: https://spark.apache.org/ and [Apache Hadoop]:https://hadoop.apache.org/ clusters in a simpler, more cost-efficient way.
This variety also presents challenges to architects and engineers looking at moving to Google Cloud Platform in selecting the best technology stack based on their requirements and to process large volumes of data in a cost-effective yet reliable manner.
In the following sections, we look at the research we had undertaken to provide interactive business intelligence reports and visualizations for thousands of end-users. Furthermore, as these users can concurrently generate a variety of such interactive reports, we need to design a system that can analyze billions of data points in real-time.
. . .
Requirements
For technology evaluation purposes, we narrowed down to following requirements –
- Raw data set of 175TB size: This dataset is quite diverse with scores of tables and columns consisting of metrics and dimensions derived from multiple sources.
- Catering to 30,000 unique users
- Serving up to 60 concurrent queries to the platform users
The problem statement due to the size of the base dataset and requirement for a high real-time querying paradigm requires a solution in the Big Data domain.
. . .
Salient Features of Proposed Solution
The solution took into consideration following 3 main characteristics of the desired system:
- Analyzing and classifying expected user queries and their frequency.
- Developing various pre-aggregations and projections to reduce data churn while serving various classes of user queries.
- Developing state of the art ‘Query Rewrite Algorithm’ to serve the user queries using a combination of aggregated datasets. This will allow the Query Engine to serve maximum user queries with minimum number of aggregations.
. . .
Tech Stack Considerations
For benchmarking performance and the resulting cost implications, following technology stack on Google Cloud Platform were considered:
Cloud DataProc + Google Cloud Storage
For Distributed processing – Apache Spark on Cloud DataProc
For Distributed Storage – Apache Parquet File format stored in Google Cloud StorageCloud DataProc + Google BigQuery using Storage API
For Distributed processing – Apache Spark on Cloud DataProc
For Distributed Storage – BigQuery Native Storage (Capacitor File Format over Colossus Storage) accessible through BigQuery Storage APINative Google BigQuery for both Storage and processing – On Demand Queries
Using BigQuery Native Storage (Capacitor File Format over Colossus Storage) and execution on BigQuery Native MPP (Dremel Query Engine)
All the queries were run in on demand fashion. Project will be billed on the total amount of data processed by user queries.Native Google BigQuery with fixed price model
Using BigQuery Native Storage (Capacitor File Format over Colossus Storage) and execution on BigQuery Native MPP (Dremel Query Engine)
Slots reservations were made and slots assignments were done to dedicated GCP projects. All the queries and their processing will be done on the fixed number of BigQuery Slots assigned to the project.
. . .
Tech Stack Performance Comparison
After analyzing the dataset and expected query patterns, a data schema was modeled. Dataset was segregated into various tables based on various facets. Several layers of aggregation tables were planned to speed up the user queries.
All the user data was partitioned in time series fashion and loaded into respective fact tables. Furthermore, various aggregation tables were created on top of these tables. All the metrics in these aggregation tables were grouped by frequently queried dimensions.
In the next layer on top of this base dataset various aggregation tables were added, where the metrics data was rolled up on a per day basis.
All the probable user queries were divided into 5 categories –
- Raw data and lifting over 3 months of data
- Aggregated data and lifting over 3 months of data
- Aggregated data over 7 days.
- Aggregated data over 15 days.
- Raw data over 1 month.
The total data processed by individual query depends upon time window being queried and granularity of the tables being hit.
Query Response times for large data sets – Spark and BigQuery
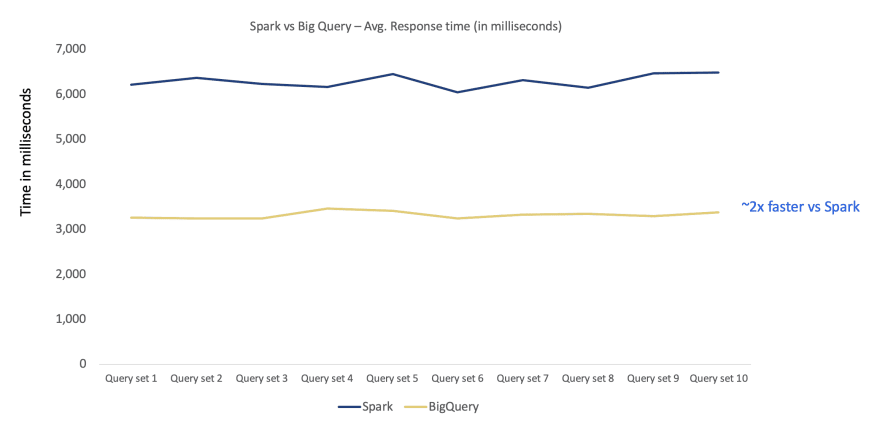
Test Configuration
Total Threads = 60,Test Duration = 1 hour, Cache OFF
1) Apache Spark cluster on Cloud DataProc
Total Nodes = 150 (20 cores and 72 GB), Total Executors = 1200
2) BigQuery cluster
BigQuery Slots Used = 1800 to 1900
Query Response times for aggregated data sets – Spark and BigQuery

Test Configuration
Total Threads = 60,Test Duration = 1 hour, Cache OFF
1) Apache Spark cluster on Cloud DataProc
Total Machines = 250 to 300, Total Executors = 2000 to 2400, 1 Machine = 20 Cores, 72GB
2) BigQuery cluster
BigQuery Slots Used: 2000
Performance testing on 7 days data – Big Query native & Spark BQ Connector
It can be seen that BigQuery Native has a processing time that is ~1/10 compared to Spark + BQ options

Performance testing on 15 days data – Big Query native & Spark BQ Connector
It can be seen that BigQuery Native has a processing time that is ~1/25 compared to Spark + BQ options

Processing time seems to reduce with increase in the data volume
Longevity Tests – BigQuery Native REST API
Once it was established that BigQuery Native outperformed other tech stack options in all aspects. We also ran extensive longevity tests to evaluate the response time consistency of data queries on BigQuery Native REST API.

It is evident from the above graph that over long periods of running the queries, the query response time remains consistent and the system performance and responsiveness doesn’t degrade over time.
. . .
ETL performance – BigQuery Native
To evaluate the ETL performance and infer various metrics with respect to the execution of ETL jobs, we ran several types of jobs at varied concurrency.

In BigQuery, similar to interactive queries, the ETL jobs running in batch mode were very performant and finished within expected time windows. This should allow all the ETL jobs to load hourly data into user facing tables and complete in a timely fashion.
Running the ETL jobs in batch mode has another benefit. All jobs running in batch mode do not count against the maximum number of allowed concurrent BigQuery jobs per project.
. . .
Comparing costs – BigQuery & Spark
Here we capture the comparison undertaken to evaluate the cost viability of the identified technology stacks.
Actual Data Size used in exploration:
Two Months billable dataset size in BigQuery: 59.73 TB.
Two Months billable dataset size of Parquet stored in Google Cloud Storage: 3.5 TB. Parquet file format follows columnar storage resulting in great compression, reducing the overall storage costs.

Actual Data Size used in exploration-
BigQuery 2 Months Size (Table): 59.73 TB
Spark 2 Months Size (Parquet): 3.5 TB
In BigQuery – storage pricing is based on the amount of data stored in your tables when it is uncompressed
In BigQuery – even though on disk data is stored in Capacitor, a columnar file format, storage pricing is based on the amount of data stored in your tables when it is uncompressed. Hence, Data Storage size in BigQuery is ~17x higher than that in Spark on GCS in parquet format.
. . .
Conclusion
- For both small and large datasets, user queries’ performance on BigQuery Native platform was significantly better than that on Spark Dataproc cluster.
- Query cost for both On Demand queries with BigQuery and Spark based queries on Cloud DataProc is substantially high.
- Using BigQuery with Flat-rate priced model resulted in sufficient cost reduction with minimal performance degradation.


Top comments (0)