
Introduction
In technical engineering projects, especially those involving software system designs, professional diagrams play a critical role in simplifying complexity and enhancing communication.
In this blog, I'll walk you through how I combine Claude AI with draw.io to create clean, structured, and visually appealing diagrams for complex codebases.
We’ll demonstrate using a slightly complex system:
✅ Online Course Registration System (with Admin + Payment integration).
Why Visual Diagrams Are Essential for Engineers
- 📈 Improve project documentation quality
- 🧠 Clarify system architecture and workflows
- 🖼️ Impress during project evaluations, internships, and freelancing
- 🛠️ Save time during collaboration and debugging
Whether it’s API design, microservices, database flow, or user journey, good diagrams are crucial.
📋 Problem Statement
Design a backend flow for an Online Course Registration System.
Key Components:
- Student browses available courses
- Admin manages courses
- Student selects course → payment gateway integration → enrollment confirmation
- Admin can approve or reject course creation requests
- System should handle payment failure cases
🛤️ Step-by-Step Walkthrough
Step 1: Write a Detailed System Description
Before jumping into tools, clearly understand what you want to visualize. Draft a logical description of how the system components interact. This involves:
- Analyzing the source: For example, a source-code, pseudocode, or algorithm.
- Writing a short description: Explain the logic or flow in simple language.
- Identifying elements: Note down components like processes, inputs/outputs, functions, or actors that should be part of the diagram.
📌 Tip: This step can be manual or done in collaboration with AI by summarizing the core logic of your code/process.
Description Example:
- Student browses available courses.
- Student selects a course → proceeds to payment.
- System connects to Payment Gateway API.
- If payment is successful → student enrollment confirmed.
- If payment fails → show error and retry option.
- Admin manages course creation, edits, deletions.
- Admin can approve/reject newly created course entries.
Step 2: Ask Claude to Generate draw.io XML Code
Once you have the logical structure ready, use a detailed prompt to ask Claude AI to generate an XML-based diagram compatible with draw.io.
Claude AI is better at generating longer, cleaner code blocks compared to ChatGPT.
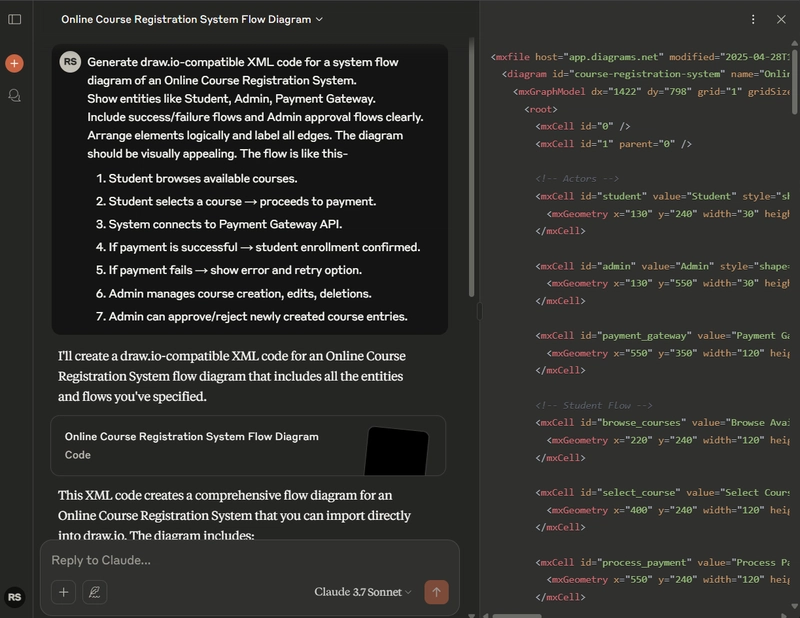
Example Claude Prompt:
“Generate draw.io-compatible XML code for a system flow diagram of an Online Course Registration System.
Show entities like Student, Admin, Payment Gateway.
Include success/failure flows and Admin approval flows clearly.
Arrange elements logically and label all edges. The diagram should be visually appealing. The flow is like this-
- Student browses available courses.
- Student selects a course → proceeds to payment.
- System connects to Payment Gateway API.
- If payment is successful → student enrollment confirmed.
- If payment fails → show error and retry option.
- Admin manages course creation, edits, deletions.
- Admin can approve/reject newly created course entries.”
🎯 Claude responds with a complete XML.
📌 Tip: You can even provide entire source code, if it is single file. Claude will automatically figure out the flow of program.
Step 3: Create and Save the .drawio File
Steps:
- Copy the XML output.
- Open a text editor.
- Paste XML content.
- Save as:
📝
course_flow.drawio
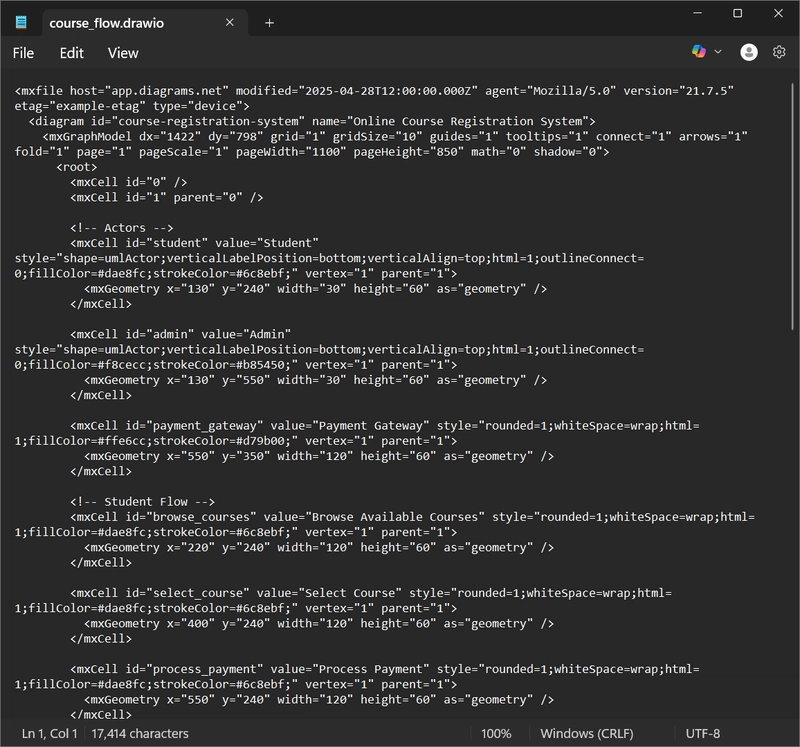
⚠️ Make sure to select All Files type when saving.
Step 4: Import into draw.io
There are two ways to do this:
1. Via Web App:
- Go to https://app.diagrams.net/
- Click Device → Open Existing Diagram.
- Select your
.drawiofile.
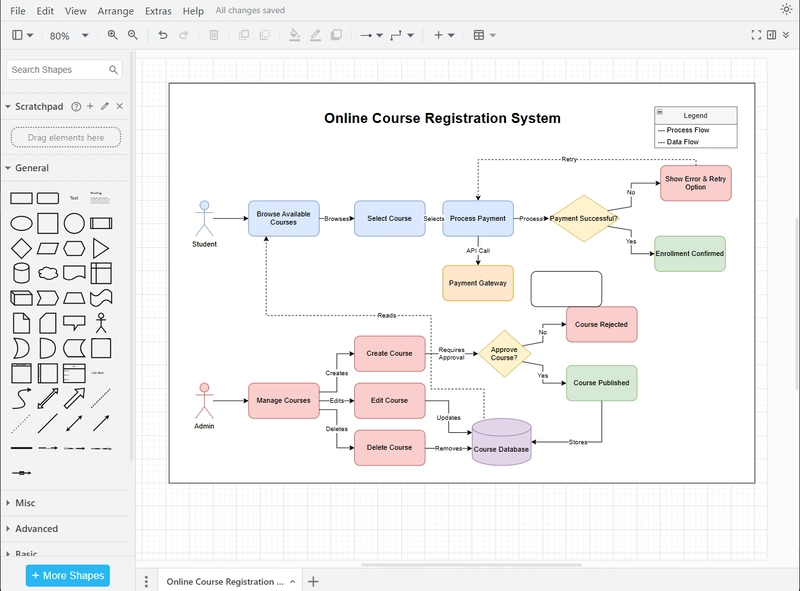
✅ Your system diagram should now appear automatically!

2. Via Desktop App: If you have the draw.io desktop application installed, simply open the file using it.
Step 5: Manual Adjustments for Visual Appeal
The imported diagram often needs cleanup for a professional look:
- Align boxes horizontally and vertically
- Color-code actors (Student, Admin, Payment Gateway)
- Label edges (e.g., "If Payment Fails", "Admin Approves")
- Use consistent shape sizing
🎨 Design Tips:
- Use different shapes for different entity types (rectangles for processes, diamonds for decisions).
- Stick to 2–3 soft colors (sky blue, light green, soft grey).
- Leave good spacing between elements.
- Add a plain rectangle as a background, to enable appropriate exporting of complete image(as png/jpg etc).
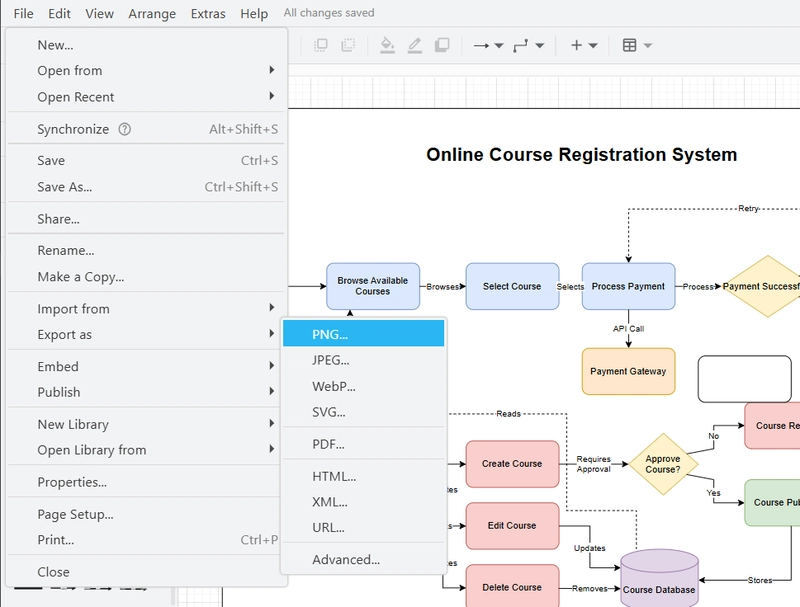
Step 6: Export the Final Diagram
Once finalized:
- File → Export As → PNG / PDF
- Enable "Include a copy of my diagram" for backup.
- Set high resolution for better quality.
🎯 Final Result
✅ A professional system diagram ready for:
- Project documentation
- Presentations
- Freelance portfolios
- Technical blogs
⚠️ Notes on AI Limitations
Code Length: ChatGPT has a limit on how much XML code it can generate. For complex or very large diagrams, consider alternatives like Claude AI, which can handle longer outputs.
Split Diagrams: For large systems, divide the diagram into smaller parts and generate/import them separately.
Verification: Always cross-check the logic and flow; AI may introduce small inconsistencies.
Extra Bonus Tip: What to Do Next?
- 💬 Add internal comments inside draw.io diagrams
- 🔄 Use this workflow for ER diagrams, UMLs, flowcharts, API flows


Top comments (2)
Very useful guide! Loved the idea of combining Claude AI with draw.io for quick architecture diagrams.
Thank you for appreciation!!❤️