In this post, we take a look at the Iris dataset in R.
This dataset was first published by UCI ML repository. And later heavily used by the R, Python and other data science communities in their testing.
Most of the data science students use the Iris for variety of reasons. Be it for plotting some of the basic plots. Another use case is with trying out some of the R and python functions which allow them to clean and manipulate data in this dataset.
Take a look at the below video if you prefer the video instructions.
Let's see how you can use it with RStudio. It comes preloaded with the RStudio so you should give it a shot.
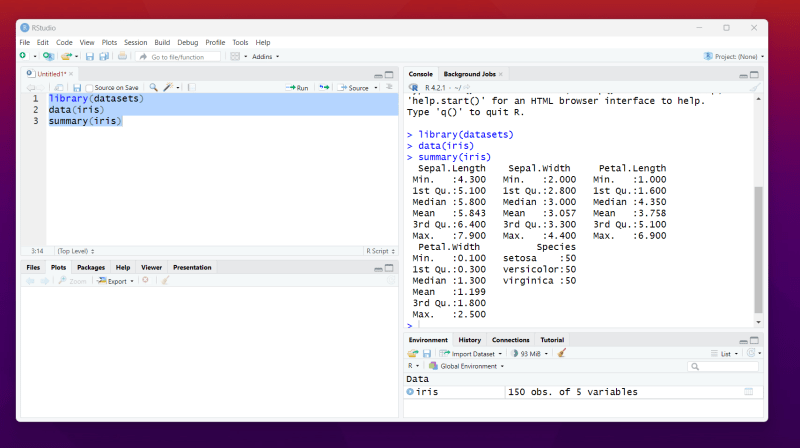
Try the code below.
library(datasets)

data(iris)

summary(iris)
When you run the code you would get the results like this.
You can take a look at the raw dataset of Iris here.
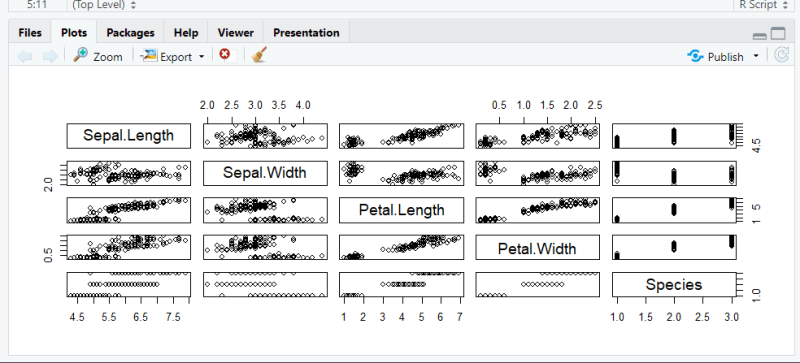
If you use the plot function and manage to send entire iris dataset you would get multiple plots too.
for plotting you use the function.
plot(iris)
As you can see this dataset can be pretty handy for those who want to manipulate data while learning data analytics and data science as a part of your degree or maybe job.
I hope this helps anyone who is trying to learn the data science and exploring the dataset on their own.


Top comments (0)