
Written by Anna Monus✏️
Slow-loading pages can stem from multiple causes, which makes them one of the most challenging issues to fix in web development. Lighthouse (LH) is Google’s free and open-source website auditing tool that can help you detect and solve your web performance issues and speed up your site.
In this post, we’ll look into what Lighthouse audits are, how to interpret them, what they look like on a real website, and how to generate them in different ways. For the examples, we’ll use the homepage of the Mozilla Developer Network.
What are Lighthouse audits?
Lighthouse audits are automated diagnostic checks that evaluate different aspects of the user experience and performance of a web page. They are part of a Lighthouse report that you can generate by running the LH tool on a web page.
We’ll see later how to do this, but the easiest way is to use the Lighthouse tab in Chrome DevTools, which is what I’ll do for the screenshots below). There are four categories of Lighthouse audits — Performance, Accessibility, Best Practices, and SEO. In this article, we’ll focus on Lighthouse’s Performance audits:  Note that when developers speak about ‘Lighthouse audits’, they typically mean Performance audits (when discussing other categories, they tend to refer to them by name, e.g. "SEO audits in Lighthouse").
Why are Lighthouse’s Performance audits important?
Currently, there are 38 different Lighthouse Performance audits. Each approaches web performance from a different angle to help you understand one distinct reason behind poor or mediocre Web Vitals scores, slow-loading pages, or high bounce rates. In addition to the numeric evaluation, which shows whether a page passes the threshold for the metric used for the specific audit (e.g., initial server response time), each LH audit provides hands-on recommendations about how you can improve your result (in case it needs improvement). Lighthouse audits can also help you fix your Core Web Vitals, which are part of Google’s Page Experience signals. Therefore, they have a direct impact on your search engine rankings.
How are Lighthouse and Core Web Vitals related?
Lighthouse measures Web Vitals (including Core Web Vitals) and shows them at the top of each LH report. However, Lighthouse is a lab (a.k.a. synthetic) website auditing tool. This means that the performance tests run in a simulated environment under controlled conditions, which can be your local browser environment or a remote server. We’ll look into this below in the “6 ways to run Lighthouse” section). Google also measures Web Vitals using the same formulas, but it collects the data from real Chrome users using Real User Monitoring (RUM). Then, it aggregates this data (called field data) and publishes the results in the Chrome User Experience (CrUX) Report. Core Web Vital values from the CrUX Report (i.e., Largest Contentful Paint, Interaction to Next Paint, and Cumulative Layout Shift) are used as Page Experience signals in Google’s search engine algorithm. These field scores are also what you see in Google Search Console in the Core Web Vitals Report. By addressing your web performance issues identified by Lighthouse audits (lab data), you can improve your field scores that affect your SEO rankings (see more about the differences between lab and field data).
Where are Performance Audits in the Lighthouse Report?
You can find Lighthouse’s Performance audits as a list in the Diagnostics and Passed Audits sections, below the numeric Web Vitals values: 
Lighthouse’s color code system
Lighthouse audits use a color code system similar to the one that Google uses for the evaluation of Web Vitals, but it also includes gray in addition to the three traffic light colors:
- Red (error flag) – The audit failed
- Yellow (warning flag) – The audit needs improvement. Essentially, it means a mediocre result
- Gray (informational flag) – The audit passed, but you should still improve the result if you can. LH uses it for the most important audits
- Green (success flag) – The audit passed
Audits that received red and yellow flags are grouped into the Diagnostics section, audits with a green flag are shown in the Passed Audits section (which can be found below the former one), and audits with a gray flag can appear in either section:  Note that not all LH audits use all colors. For some audits, you can only get the gray informational flag but not the green one, as these are aspects of web performance that you should keep improving even if the page passes the audit threshold. Similarly, for some audits, you can only receive the red flag but not the yellow one, as a less-than-good result means failure for these ones in any case.
Examples of Lighthouse audits
As I mentioned above, Lighthouse currently has 38 performance audits. The below examples are from a Lighthouse desktop report run on the homepage of the Mozilla Developer Network. Note, however, that Lighthouse also has a mobile report, which may have different results for the same audits since the test page runs in a mobile viewport instead of a desktop one, and LH uses CPU and network throttling settings typical of a mobile environment.
Avoid large layout shifts
The tested page received a red flag for the Avoid large layout shift Lighthouse audit. As you can see below, LH provides a detailed explanation, including a short description of the audit, the affected Web Vitals (here, CLS), a list of the HTML elements that caused layout shifts during the test run, and a numeric value of how much each unstable element added to the CLS score:  Note that if you use a popular framework or content management system, such as Next.js or WordPress, Lighthouse also gives platform-specific recommendations (e.g., it sometimes recommends a WordPress plugin that can help fix the issue).
Serve images in next-gen formats
For the Serve images in next-gen formats audit, our test page received a yellow flag. Like above, the expanded audit shows a short explanation, the Web Vitals, the audit affects (here, FCP and LCP), the total amount of potential savings (i.e., 64 KB), and a list of the image files that could be served in next-gen formats, such as WebP or AVIF, along with the resource size and potential savings: 
Avoid an excessive DOM size
Avoid an excessive DOM size is one of the aforementioned Lighthouse audits that never assigns the green flag, as this is a web performance indicator that can cause many other issues, such as increased memory usage, longer style calculations, and more forced layout reflows.
While the test page passed the audit threshold (which is 800 nodes for the yellow flag and 1,400 nodes for the red one, according to the LH docs) with 705 DOM nodes, it still received the gray informational flag, along with numeric values for the Maximum DOM Depth and Maximum Child Elements metrics (ideally, these should be as small as possible): 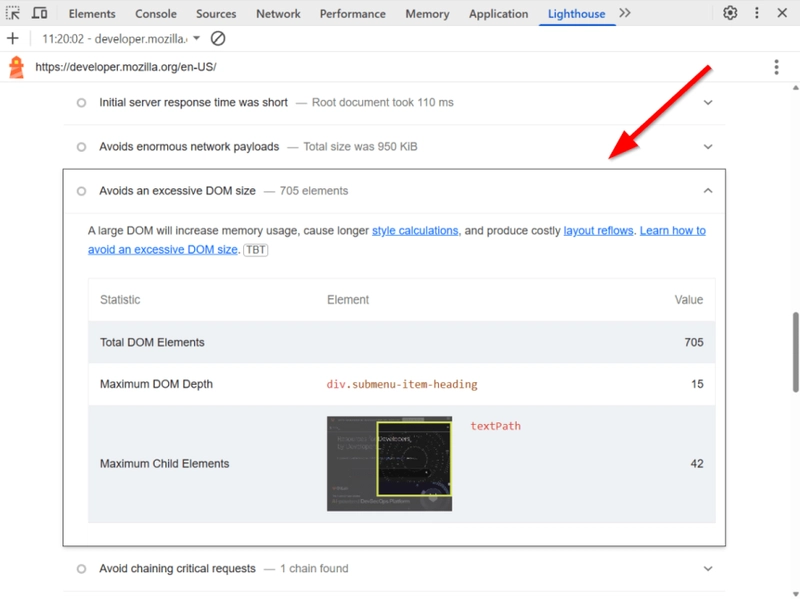
Page prevented back-forward cache restoration
Below, you can see an example of a Lighthouse audit our test page received a green flag for. Note that LH changes the text of passed audits to phrases suggesting success (e.g., Page didn’t prevent back/forward cache restoration).
Lighthouse doesn’t show numeric values or longer explanations for audits in the Passed Audits section, but it still displays a short description of the audit, along with a link to a resource that can help you understand its importance (here, about bfcache, which makes on-site navigation faster): 
6 ways to run Lighthouse
All of these options are based on the same Lighthouse API, which means the different tools use the same formulas for the calculations. The main difference between the options below is the testing environment, which can cause variation across the results for the same Lighthouse audit run with different tools.
Lighthouse in Chrome DevTools
The easiest way to run Lighthouse is to open Chrome DevTools in Incognito mode (which doesn’t load your browser extensions so they won’t affect the results).
Navigate to the Lighthouse tab, and run either a desktop or mobile test, which will re-launch the page in either a desktop- or mobile-sized browser window. Lighthouse reports run in Chrome DevTools reflect your local browsing environment, including your hardware, operating system, browser version, DevTools configuration, and more. This means that if someone else runs the same LH tests on their own machine, they can get (slightly) different results for the same audits.
PageSpeed Insights (PSI)
PageSpeed Insights (PSI) is Google’s online web performance testing tool that shows Web Vitals from the CrUX Report at the top of the PSI report (these are the field scores used in their search engine algorithm) and both the mobile and desktop Lighthouse reports run on Google’s remote servers. PSI allows you to see field and lab data below each other for the same web page, which can be especially useful for competitor analyses.
Lighthouse CLI (Command Line Interface)
Lighthouse has a command line tool that you can install with the following command:
npm install -g lighthouse
Lighthouse CLI comes with lots of options that allow you to configure the test conditions, choose the audits you want to run, change the throttling method, generate the output in different formats (e.g., HTML, JSON, etc.), and more.
Lighthouse CI (Continuous Integration)
Lighthouse CI is a suite of developer tools that allows you to add Lighthouse to your CI/CD pipeline and set up actions such as automatically running LH for every commit, comparing the results of LH audits between different builds, failing builds when certain audits fail, and more.
Lighthouse API
You can also use the Lighthouse API directly, which can be useful if you want to integrate Lighthouse features into your own Node.js application or combine LH with other tools. For more information, check out the docs about how you can run Lighthouse programmatically as a Node.js module.
LH monitoring dashboards
If you want to monitor your Lighthouse audits over time, compare them against your competitors’ results, or get alerts about regression, you can also use a Lighthouse monitoring dashboard, such as WebPageTest or DebugBear, which allow you to set up scheduled tests from different locations, collect historical Lighthouse data, see performance trends, and more.
Make the most out of Lighthouse audits
Web performance issues are part of your technical debt. They can originate from things such as legacy code, low-performing infrastructure (e.g., using a shared server), conflicts between different parts of your codebase, lack of modern frontend techniques (e.g., module bundling and caching), and other factors.
Lighthouse audits allow you to break up your web-performance-related technical debt into small, actionable changes that you can implement one by one. To optimize web performance on your site, prioritize audits with the worst results and the biggest performance impact, and then gradually work towards addressing smaller issues.
Also, check both your desktop and mobile LH results, as your site might experience performance issues on mobile that don’t exist on desktop, and vice versa. The most effective approach to maintaining consistent website health is to integrate Lighthouse audit checks into your regular web development workflow so that you can catch performance issues as soon as they emerge and address them before they start to escalate.
Get set up with LogRocket's modern error tracking in minutes:
- Visit https://logrocket.com/signup/ to get an app ID.
- Install LogRocket via NPM or script tag.
LogRocket.init()must be called client-side, not server-side.
NPM:
$ npm i --save logrocket

// Code:

import LogRocket from 'logrocket';
LogRocket.init('app/id');
Script Tag:
Add to your HTML:

<script src="https://cdn.lr-ingest.com/LogRocket.min.js"></script>
<script>window.LogRocket && window.LogRocket.init('app/id');</script>
3.(Optional) Install plugins for deeper integrations with your stack:
- Redux middleware
- ngrx middleware
- Vuex plugin


Top comments (1)
Lighthouse is definitely a handy tool, but sometimes its lab-based results don't always match the real-world user experience, especially for dynamic sites or those with lots of personalization. Do you have any tips for bridging the gap between what Lighthouse reports and what actual users face?