
As enterprises increasingly rely on Amazon EKS to run scalable, containerized applications, securing communication between microservices has become a foundational need. AWS promotes zero-trust security models, and integrating a service mesh is a recommended approach for achieving secure service-to-service traffic, observability, and reliability.
Linkerd, a lightweight and production-ready CNCF-graduated service mesh, is an excellent choice for AWS users seeking seamless integration with EKS and minimal complexity. It brings powerful features like mTLS encryption, traffic splitting, latency-aware routing, and real-time metrics.
✅ Use Case: In highly regulated industries such as finance or healthcare, applications running on EKS often require end-to-end encryption, fine-grained traffic control, and detailed observability to meet compliance and reliability standards. This blog shows how to deploy Linkerd on Amazon EKS to meet those requirements and secure your Kubernetes-based microservices architecture with confidence.
What is a Service Mesh?
A service mesh is a tool designed to enhance security, reliability, and observability in cloud-native applications. It achieves this by transparently inserting these features at the platform layer, instead of requiring changes to the application layer.
This abstraction allows developers to focus on business logic while the service mesh handles concerns like traffic control, encryption, and monitoring. It is increasingly becoming a standard component of the cloud-native stack, particularly for Kubernetes adopters, where it simplifies complex service-to-service communication and ensures robust performance at scale.
Key Features of a Service Mesh
Service-to-Service Communication:
Manages how services within a cluster discover and communicate with one another.
Handles retries, timeouts, and load balancing automatically.
Observability:
Provides insights into service performance through metrics, logs, and distributed tracing.
Tools like Prometheus, Grafana, and Jaeger are often integrated.
Traffic Management:
Enables advanced traffic control, such as canary deployments, blue-green deployments, and traffic splitting.
Security:
Implements mutual TLS (mTLS) to encrypt traffic between services.
Supports policies for secure communication and access control.
Resilience:
Handles service failures gracefully with retries, circuit breaking, and fault injection.
What is Linkerd Service Mesh?
Linkerd is a lightweight, open-source service mesh specifically designed for Kubernetes environments. It focuses on providing security, observability, and reliability for cloud-native applications by managing service-to-service communication within a cluster. Developed as a CNCF (Cloud Native Computing Foundation) project, Linkerd is known for its simplicity, efficiency, and ease of use.
Key Features of Linkerd
Security:
mTLS (Mutual TLS): Encrypts traffic between services automatically, ensuring secure communication without modifying application code.
Automatic certificate rotation and strong identity guarantees.
Observability:
Provides golden metrics (latency, success rate, and request volume) for services.
Tools for real-time inspection of service behavior, such as linkerd stat and linkerd tap.
Integration with observability tools like Prometheus, Grafana, and Jaeger for metrics and tracing.
Reliability:
Traffic policies for fine-grained control over communication between services.
Automatic retries and timeouts to handle transient failures.
Traffic splitting for blue-green or canary deployments.
Lightweight:
Minimal resource overhead compared to other service meshes like Istio.
Uses Rust-based proxies for efficiency and performance.
Ease of Use:
Simple installation and configuration process with a CLI (linkerd install).
Pre-configured defaults for Kubernetes clusters, making it beginner-friendly.
Use Cases for Linkerd
Enhancing Security: Automatic encryption of inter-service traffic using mTLS.
Traffic Management: Blue-green deployments, canary releases, and traffic shaping.
Monitoring and Debugging: Golden metrics and real-time traffic inspection for better observability.
Resilience and Recovery: Automatic retries, circuit breaking, and failure handling.
Step 1: Create the EKS Cluster Without Any Node Groups
Create an EKS cluster without a node group using the eksctl command eksctl create cluster --name=eks-linkerd --region=eu-west-1 --without-nodegroup. By default, eksctl creates a node group with m5.large instances, so we used the --without-nodegroup option to skip creating a default node group
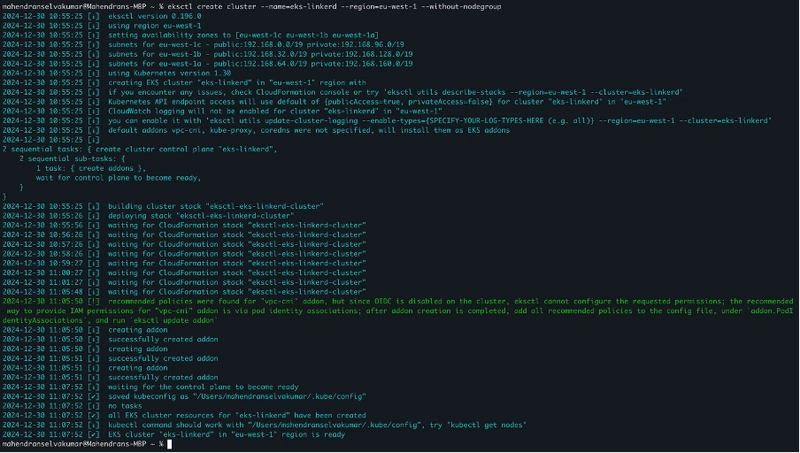
Go to the EKS console to verify that the cluster was successfully created using eksctl

Step 2: Create a Managed Node Group
Add a node group using the following separate eksctl command eksctl create nodegroup --name eks-linkerd-ng --cluster eks-linkerd --region eu-west-1 --nodes 2 --nodes-min 1 --nodes-max 3 --node-type t3.medium

Explanation of the flags:
— cluster: Specifies the name of the existing EKS cluster to which the node group will be added.
— name: Names the node group for easy identification.
— region: Specifies the AWS region.
— nodes: Sets the initial desired number of nodes (in this case, 2).
— nodes-min and — nodes-max: Define the minimum and maximum number of nodes for auto-scaling.
— node-type: The EC2 instance type for the nodes (e.g., m5.large)
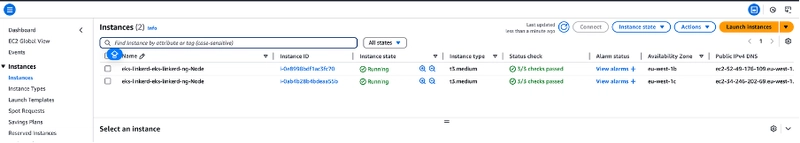
If you check in the console, you’ll see that the node group has been created

In the instances section of the EC2 console, you can view the Instances created for the node group
Step 3: Configure Context for EKS Cluster
Set the Kubernetes context for the EKS cluster using the following command: aws eks --region eu-west-1 update-kubeconfig --name eks-linkerd

Use kubectl get ns to view namespaces and kubectl get nodes to check the status of the nodes in the cluster, verifying that the setup is complete

Step 4: Install the Linkerd CLI
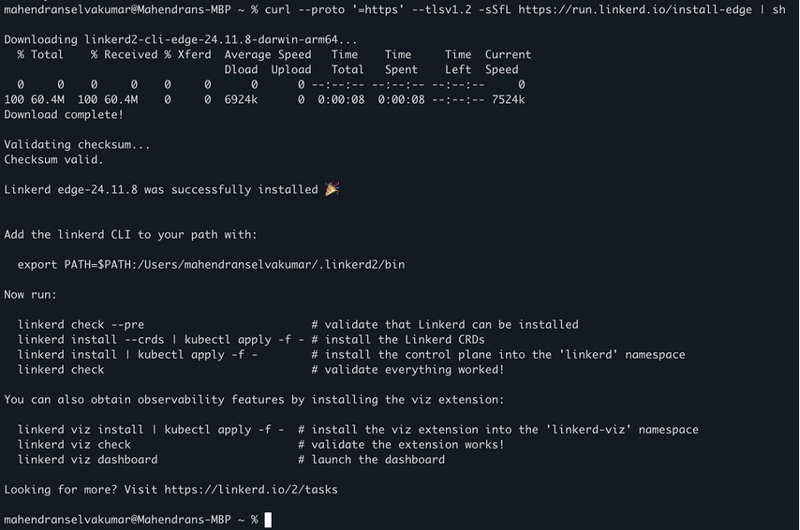
Download the latest version of the Linkerd CLI using this command curl --proto ‘=https’ --tlsv1.2 -sSfL https://run.linkerd.io/install-edge | sh
Note: The install-edge URL is for downloading the edge (pre-release) version of Linkerd. Use install for the stable release unless you specifically need the edge version
Run this command export PATH=$PATH:$HOME/.linkerd2/bin to add the Linkerd CLI to your system’s PATH

Verify the installation using this command linkerd version

Note: If the output shows Server version: unavailable, it means the Linkerd control plane has not yet been installed on your cluster
Step 5: Validate Your Kubernetes Cluster
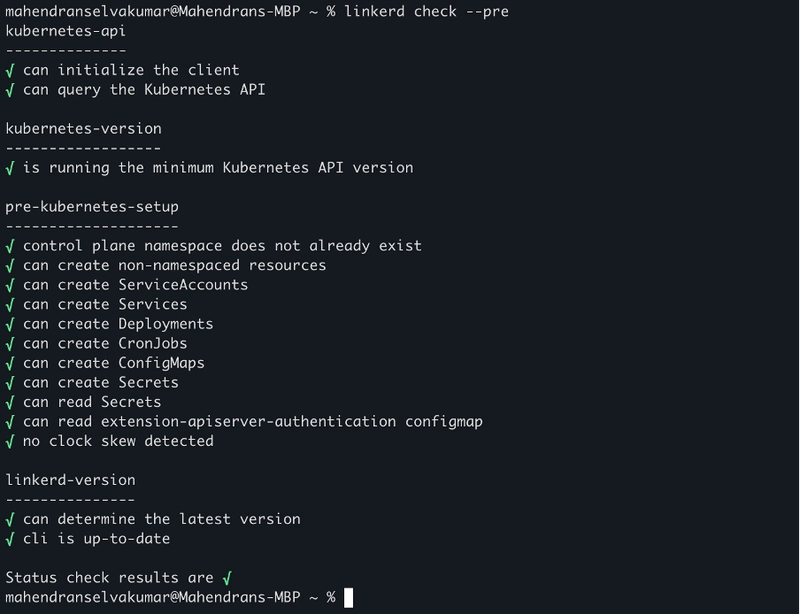
Run the pre-check command linkerd check –pre to ensure your Kubernetes cluster meets Linkerd’s requirements
Step 6: Install Linkerd on your EKS cluster
Run this command linkerd install — crds | kubectl apply -f — to install Linkerd’s Custom Resource Definitions (CRDs),which must be installed before the control plane

Install the Linkerd control plane using this command linkerd install | kubectl apply -f -

Now check the version again using this command linkerd version and you should now see both the Client version and the Server version displayed

Validate the installation using linkerd check command and Ensure that all checks pass successfully to confirm that the Linkerd control plane is properly installed and functioning

Step 7: Install the viz extension on EKS Cluster
The Linkerd dashboard provides a high level view of what is happening with your services in real time. It can be used to view “golden metrics” (success rate, requests/second and latency), visualize service dependencies and understand the health of specific service routes.
Run this command linkerd viz install | kubectl apply -f — to install viz extensions which includes a Prometheus instance, metrics-api, tap, tap-injector, and web components. These components work together to provide an on-cluster metrics stack

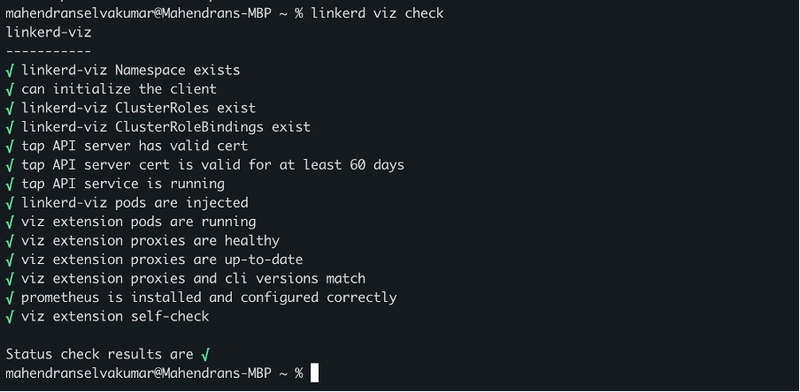
Run linkerd viz check command to validate the viz installation and Ensure all checks pass successfully to confirm that the Viz extension is properly installed and functioning
Step 8: Access the Linkerd Dashboard
Launch the Linkerd dashboard using this command linkerd viz dashboard. This will open the Linkerd dashboard in your default web browser, providing a visual interface to monitor metrics and observe your meshed workloads

Once the Linkerd dashboard is launched, you can view the golden metrics for your meshed workloads. Once the Linkerd dashboard is launched, you can view the golden metrics for your meshed workloads. These metrics include:
Success Rate: The percentage of successful requests between services.
Requests per Second (RPS): The volume of traffic handled by each service.
Latency: The time it takes for requests to be processed, broken down into P50, P95, and P99 percentiles.
These metrics provide valuable insights into the performance and health of your microservices.

Step 9: Install the Linkerd-Jaeger extension on EKS Cluster
Run this command linkerd jaeger install | kubectl apply -f — to install linkerd-jaeger extension for distributed tracing

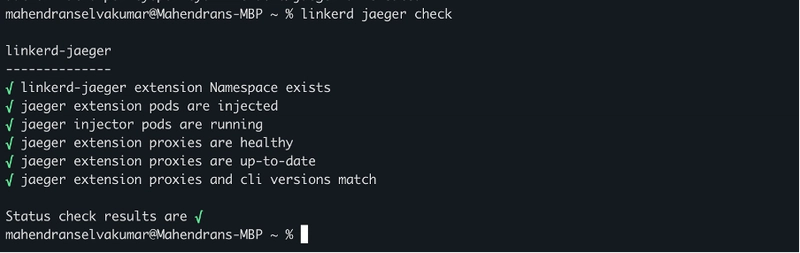
You can verify that the Linkerd-Jaeger extension was installed correctly by running this command linkerd jaeger check.Ensure all checks pass successfully to confirm that the Jaeger extension is properly installed and functional
Run this command linkerd jaeger dashboard to explore the Jaeger dashboard for distributed tracing. This will open the Jaeger dashboard in your default web browser, allowing you to visualize and analyze trace data for your services

This command will launch the Jaeger UI dashboard and you can access the jaeger dashboard with this URL http://localhost:16686

Here, you can visualize and analyze the traces for your meshed services
Step 10: Uninstall Linkerd Extensions
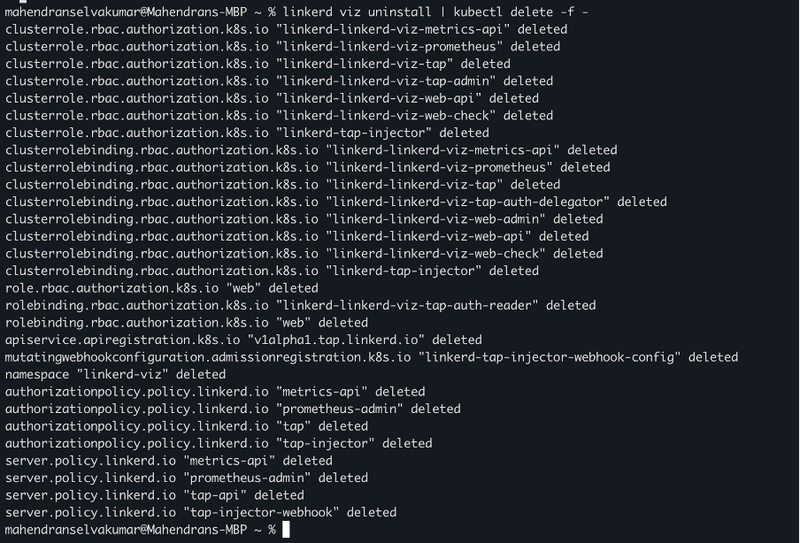
Uninstall the Viz Extension using this command linkerd viz uninstall | kubectl delete -f –
Uninstall the Jaeger Extension using this command linkerd jaeger uninstall | kubectl delete -f –

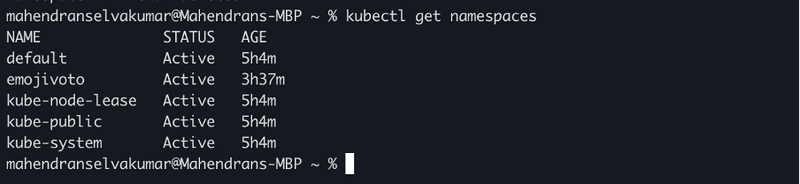
Check that their associated namespaces have been removed using kubectl get namespaces command

Step 11: Uninstall the Linkerd Control Plane
Run this linkerd uninstall | kubectl delete -f — command to uninstall the Linkerd control plane

Verify that the linkerd namespace is removed
Step 12: Remove Linkerd CRDs
To ensure all Linkerd Custom Resource Definitions (CRDs) are removed using this command kubectl delete crds -l linkerd.io/control-plane-ns=linkerd

Conclusion
Linkerd is a reliable and lightweight service mesh that adds security, observability, and reliability to your cloud-native applications. This guide covered the steps to set up Linkerd on AWS EKS, including installing the control plane, enabling observability with the Viz extension, and setting up distributed tracing with the Jaeger extension.
With Linkerd installed, your microservices are now equipped with features like automatic mTLS encryption, real-time metrics, and distributed tracing, helping you better manage and monitor your Kubernetes workloads. These tools make it easier to ensure secure, efficient, and reliable communication between services.
This setup provides a solid foundation for managing microservices in a Kubernetes environment, with the flexibility to scale and extend as needed.
Keep Learning, Keep Mesh-ing!!!
For more insightful content on AWS best practices, cloud security, devops and technology updates, don’t forget to follow me! 🚀
Feel free to reach out to me, if you have any other queries or suggestions
Stay connected on Linkedin https://www.linkedin.com/in/mahendran-selvakumar/


Top comments (1)
Great Blog, Definitely Gonna try it!!