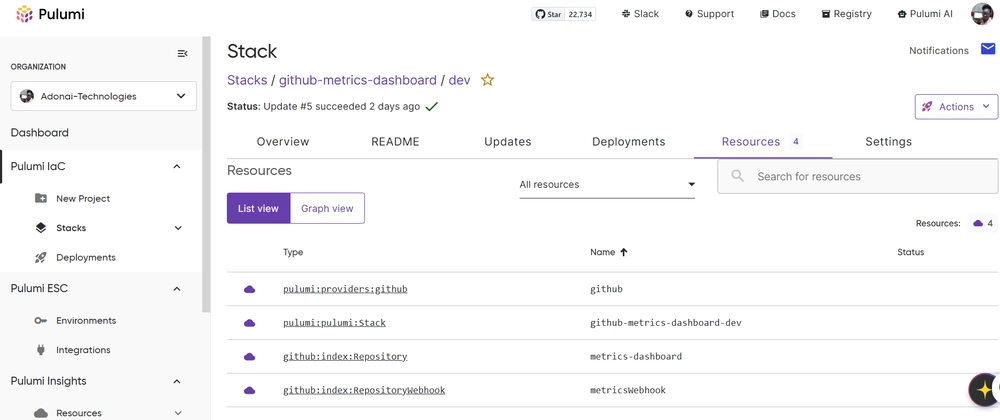
This is a submission for the Pulumi Deploy and Document Challenge: Get Creative with Pulumi and GitHub
What I Built
This project is a GitHub Metrics Dashboard, built for the Get Creative with Pulumi and GitHub Challenge. It automates GitHub analytics visualization using Pulumi, GitHub Webhooks, and Grafana. The system collects GitHub repository events, processes them, and displays them in a Grafana dashboard for real-time insights.
Live Demo Link
Project Repo
https://github.com/Adonai-Technologies/GitHub-Metrics-Dashboard-Pulumi-Grafana-.git
GitHub Metrics Dashboard (Pulumi & Grafana)
Features
- Automated GitHub Metrics Collection – Uses webhooks to track repository activity.
- Pulumi Infrastructure as Code (IaC) – Deploys and configures cloud resources.
- Grafana Visualization – Presents GitHub analytics with rich dashboards.
- Scalable and Flexible – Supports multiple repositories and event types.
Tech Stack
- Pulumi (Infrastructure as Code)
- GitHub Webhooks (Event Processing)
- Node.js & TypeScript (Webhook Receiver)
- Grafana (Metrics Visualization)
- Cloudflare Tunnel (Webhook Exposure)
Setup Guide
1️⃣ Clone the Repository
git clone https://github.com/yourusername/github-metrics-dashboard.git
cd github-metrics-dashboard
2️⃣ Install Dependencies
npm install
3️⃣ Set Up Webhook Receiver
cd webhook-receiver
npm install
node index.js
If successful, you should see:
Webhook receiver running on port 4000
4️⃣ Expose Webhook Receiver
cloudflared tunnel --url http://localhost:4000
This generates a public URL, e.g.:
https://your-tunnel.trycloudflare.com
5️⃣ Configure GitHub Webhook
- Go to your GitHub repository.
- Navigate to Settings > Webhooks.
- Click Add Webhook.
- Set the Payload URL to
https://your-tunnel.trycloudflare.com/github-webhook. - Choose application/json as the content type.
- Select the events (push, pull request, issues, etc.).
- Click Add Webhook.
6️⃣ Deploy to Cloud with Pulumi
Ensure you have Pulumi installed and configured.
pulumi up
7️⃣ Access Grafana Dashboard
Once Pulumi provisions Grafana, access it via the provided URL and configure data sources.
Contribution
Contributions are welcome! Feel free to submit issues and pull requests.
License
MIT License. See LICENSE for details.
🚀 Built for the Get Creative with Pulumi and GitHub Challenge!
My Journey
Initial Planning & Conceptualization
The project began with brainstorming ideas for the Get Creative with Pulumi and GitHub Challenge. The goal was to automate GitHub analytics visualization using Pulumi and Grafana, making it easier to track repository activity in real-time.
⚙️ Setting Up Pulumi & Webhook Receiver
Pulumi Setup: We used Pulumi to define cloud resources for deploying the webhook receiver and Grafana dashboard.
Webhook Receiver: Implemented using Node.js & TypeScript, it listens for GitHub events and processes them.
Cloudflare Tunnel: Used to expose the webhook receiver to GitHub.
🚧 Challenges Faced & Solutions
🔒 Webhook Exposure Issues
Problem: Ngrok required a paid plan for custom domains, and localtunnel was unreliable.
Solution: Switched to Cloudflare Tunnel, which provided a stable public URL.
💾 Webhook Signature Validation
Problem: GitHub webhooks require a secret signature for security, which initially caused authentication failures.
Solution: Implemented HMAC verification to validate GitHub signatures before processing events.
📊 Grafana Deployment & Data Ingestion
Problem: Configuring Grafana to pull data from the webhook receiver was challenging.
Solution: Used a time-series database (e.g., Prometheus) to store webhook data and connected it to Grafana.
🎯 What We Learned
✅ Infrastructure as Code (IaC) with Pulumi – Automating infrastructure deployment made setup reproducible and scalable.
✅ GitHub Webhook Security – Implementing proper authentication for webhooks is critical.
✅ Grafana Dashboarding – Visualizing GitHub repository activity in real-time provides valuable insights.
Using Pulumi with GitHub
Pulumi played a crucial role in automating infrastructure deployment for this project. We used Pulumi's TypeScript SDK to define and provision resources dynamically, making the setup more reproducible and scalable.
🔹 Key Pulumi Implementations:
Provisioning a Webhook Receiver – Pulumi was used to deploy a cloud-based webhook receiver to process GitHub events.
*Deploying Grafana *– Pulumi automated the setup of a Grafana instance for visualizing GitHub metrics.
Configuring Cloud Resources – Instead of manually managing infrastructure, Pulumi managed hosting, networking, and security configurations as code.
🚀 Why Pulumi?
✅ Infrastructure as Code (IaC) – Allowed us to declaratively define infrastructure, reducing manual errors.
✅ Automated Deployment – One command (pulumi up) deploys the entire system.
✅ Multi-Cloud & Flexible – Pulumi supports various cloud providers, making future expansions easier.


Top comments (1)
Where is ur live link